

OTTAWA, Ontario Tuesday, March 16, 2021) — Canadian national home sales set another all-time record, last month, according to statistics, released yesterday, by the Canadian Real Estate Association (CREA).
Home sales, recorded over CREA’s Canadian Multiple Listing Service (MLS®), climbed 6.6%, between January and February, to set another new, all-time record. Seasonally-adjusted activity was running at an annualized pace of 783,636 units in February, and CREA’s revised forecast for 2021, is in the neighbourhood of 700,000 home sales.
“Strong demand notwithstanding, sales may be hard-pressed to maintain current activity levels in the traditionally busier spring months, absent a surge of much-needed new supply; although, that could materialize as current COVID restrictions are increasingly eased and the weather starts to improve,” projected CREA in its monthly statics report.
The month-over-month increase in national sales activity, from January to February, was led by the Greater Toronto Area (GTA) and a number of other Ontario markets, along with Calgary and a number of markets in British Columbia.
“These offset a considerable decline in sales in Montreal, where new listings have started off 2021 at lower levels, compared to those recorded in the second half of last year,” CREA noted.
Actual — not seasonally adjusted — sales activity posted a 39.2% year-over-year gain in February. In line with heightened activity since last summer, it was a new record for the month of February, by a considerable margin: over 13,000 transactions.
For the eighth straight month, sales activity was up in the vast majority of Canadian housing markets, compared to the same month the previous year. Among the eight markets that posted year-over-year sales declines in February, extremely limited supply at the moment is the most likely explanation.
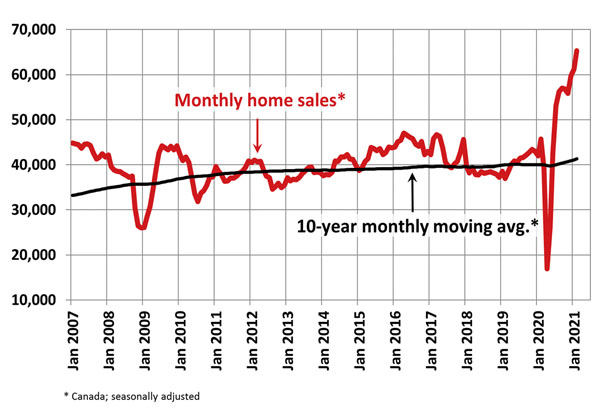
Graph credit: CREA.
“The two big challenges that continue facing Canadian housing markets are the same ones we’ve been facing for months – COVID-19 and a lack of supply. With luck, potential sellers will feel more comfortable listing their homes in the short-term.
“As lockdowns continue easing, across the country, and the spring market begins to ramp up, we will remain vigilant in adhering to all the latest government and health officials’ directives to keep our clients safe,” continued Poulopoulos.
The number of newly-listed homes rebounded by 15.7% in February, recovering all the ground lost to the drop recorded in January.
With sales-to-new listings ratios historically elevated at the moment, indicating almost everything that becomes available is selling, it was not surprising that many of the markets where new supply bounced back in February were the same markets where sales increased that month, commented the CREA report.
With the rebound in new supply outpacing the gain in sales in February, the national sales-to-new listings ratio came off the boil slightly, to reach 84%, compared to the record 91.2% posted in January. That said, the February reading came in as the second-highest on record. The long-term average for the national sales-to-new listings ratio is 54.4%, the Association’s monthly report added.
“We are right at the start of the first undisturbed (by policy or lockdown) spring housing market in years, and we also have the most extreme demand-supply imbalance ever, by a large margin. So, the question is, what is going on?”
Based on a comparison of sales-to-new listings ratio with long-term averages, only about 15% of all local markets were in balanced market territory in February, measured as being within one standard deviation of their long-term average.
The other 85% of markets were above long-term norms, in many cases well above. The first two months of 2021 and second half of 2020 have seen record numbers of markets in seller’s market territory. For reference, the pre-COVID record of only around 55% of all markets in seller’s territory was set back at the beginning of 2002.
The number of months of inventory is another important measure of the balance between sales and the supply of listings. It represents how long it would take to liquidate current inventories at the current rate of sales activity.
There were only 1.8 months of inventory on a national basis at the end of February 2021 – the lowest reading on record for this measure. The long-term average for this measure is a little over five months. At the local market level, some 40 Ontario markets were under one month of inventory at the end of February.
“We are right at the start of the first undisturbed (by policy or lockdown) spring housing market in years, and we also have the most extreme demand-supply imbalance ever, by a large margin. So, the question is, what is going on?
“I think part of it is demand that built up as a result of regulatory changes in the years, leading up to COVID, that is playing out now. Part of it is demand that is being pulled forward from the future, either in search of a home base to ride out the pandemic, or to lock down a purchase amid rapidly rising prices, while securing a record low mortgage rate,” said Shaun Cathcart, CREA’s Senior Economist.
“But maybe the biggest factor here is the emergence of existing owners with major equity, prompted by the great shake up that is COVID-19, to pull up stakes and move. First-time buyers, which we have a lot of, are now having to compete with that as well.”
The aggregate price of a home jumped by 3.3%, month-over-month in February 2021 – a record-setting increase. Of the 40 markets now tracked, all but one were up on a month-over-month basis, according to CREA’s statistics report; adding that the non-seasonally adjusted aggregate home price was up 17.3% on a year-over-year basis in February – the biggest gain since April 2017, and close to the highest on record.
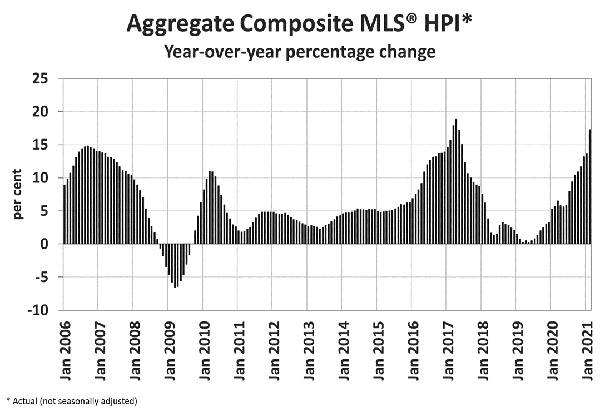
Graph credit: CREA.
The actual (not seasonally adjusted) national average home price was a record $678,091 in February 2021, up 25% from the same month last year.
The national average price is heavily influenced by sales in Greater Vancouver and the GTA, two of Canada’s most active and expensive housing markets. Excluding these two markets from calculations, cuts more than $150,000 from the national average price.


