

OTTAWA, Ontario (Tuesday, October 19, 2021) –National home sales and prices edged up, last month.
Statistics, released last Friday, by the Canadian Real Estate Association (CREA) show Home sales, recorded over its Canadian MLS® Systems, were up 0.9%, between August and September, marking the first month-over-month increase, since March.
The actual (not seasonally-adjusted) number of transactions in September 2021 was down 17.5%, on a year-over-year basis, from the record for that month, set last year, although, it was still the second-highest ever September sales figure, by a sizeable margin. See Chart A below.
“September provided another month’s worth of evidence, from all across Canada, that housing market conditions are stabilizing near current levels,” said Cliff Stevenson, Chair of CREA.
“In some ways that comes as a relief, given the volatility of the last year-and-a-half, but the issue is, that demand/supply conditions are stabilizing in a place that very few people are happy about. There is still a lot of demand chasing an increasingly-scarce number of listings, so this market remains very challenging.”
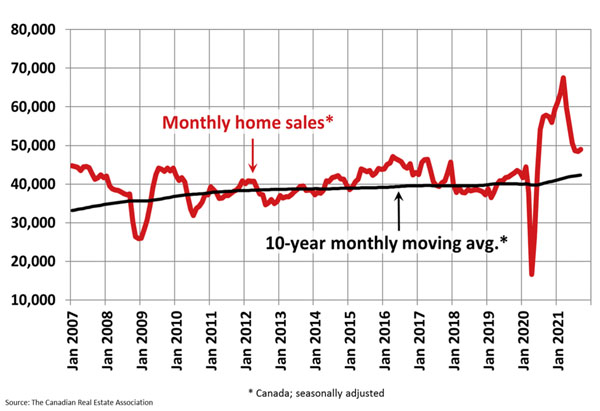
Chart A. Illustration credit: CREA.
The number of newly-listed homes fell by 1.6% in September, compared to August, as gains in parts of Quebec were overwhelmed by declines in the Lower Mainland, in and around the Greater Toronto Area (GTA) and in Calgary.
With sales up and new listings down in September, the sales-to-new listings ratio tightened to 75.1%, compared to 73.2% in August. The long-term average for the national sales-to-new listings ratio is 54.8%.
Based on a comparison of sales-to-new listings ratio with long-term averages, a small but growing majority of local markets are moving back into seller’s market territory. As of September it was close to a 60/40 split between seller’s and balanced markets.
“The small changes observed in most key housing market metrics, over the last couple of months, suggest that the worst of the pandemic-related volatility we’ve experienced, since last spring, is in the rear-view mirror at this point,” said Shaun Cathcart, CREA’s Senior Economist.
“Having said that, given we are still stuck at around 2 months of inventory nationally, the thing to keep a close eye on, going forward, will be the behaviour of prices. While the acceleration in home prices we saw in September was more than most would have expected, the fact that prices are now moving back in that direction is not surprising.”
There were 2.1 months of inventory on a national basis at the end of September, down, slightly, from 2.2 months in August and 2.3 months in June and July — extremely low and indicative of a strong seller’s market at the national level and in most local markets. The long-term average for this measure is more than 5 months.
In line with tighter market conditions, the home prices accelerated to 1.7%, on a month-over-month basis, in September.
The non-seasonally adjusted average price was up 21.5%, on a year-over-year basis, in September, up a bit from the 21.3% year-over-year gain, recorded in August. See Chart B.
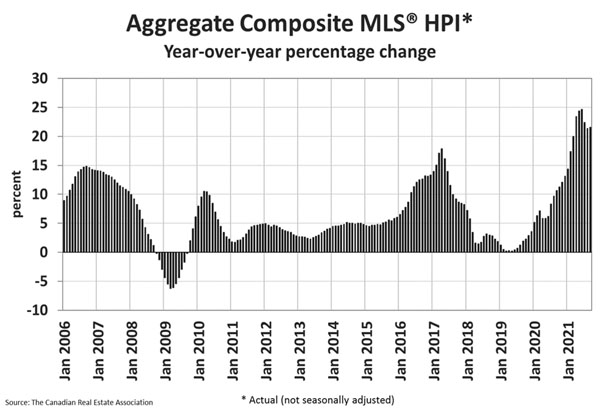
Chart B. Illustration credit: CREA.
Looking across the country, year-over-year price growth is creeping up above 20% in B.C., though it is lower in Vancouver, on par with the provincial number in Victoria, and higher in other parts of the province.
Year-over-year price gains are in the mid-to-high single digits in Alberta and Saskatchewan, while gains are into the low double-digits in Manitoba.
Ontario saw year-over-year price growth pushing 25% in September; however, as with B.C. big, medium and smaller city trends, gains are notably lower in the GTA and Ottawa, around the provincial average in Oakville-Milton, Hamilton-Burlington and Guelph, and considerably higher in many of the smaller markets around the province.
Greater Montreal’s year-over-year price growth remains at a little over 20%, while Quebec City is now at 13%. Price growth is running a little above 30% in New Brunswick (higher in Greater Moncton, a little lower in Fredericton and Saint John), while Newfoundland and Labrador is now at 12% year-over-year (a bit lower in St. John’s).
The actual (not seasonally adjusted) national average home price was $686,650 in September, up 13.9% from the same month last year.
The national average price is heavily influenced by sales in Greater Vancouver and the GTA, two of Canada’s most active and expensive housing markets. Excluding these two markets from the calculation in September, cuts over $146,000 from the national average price.


